|
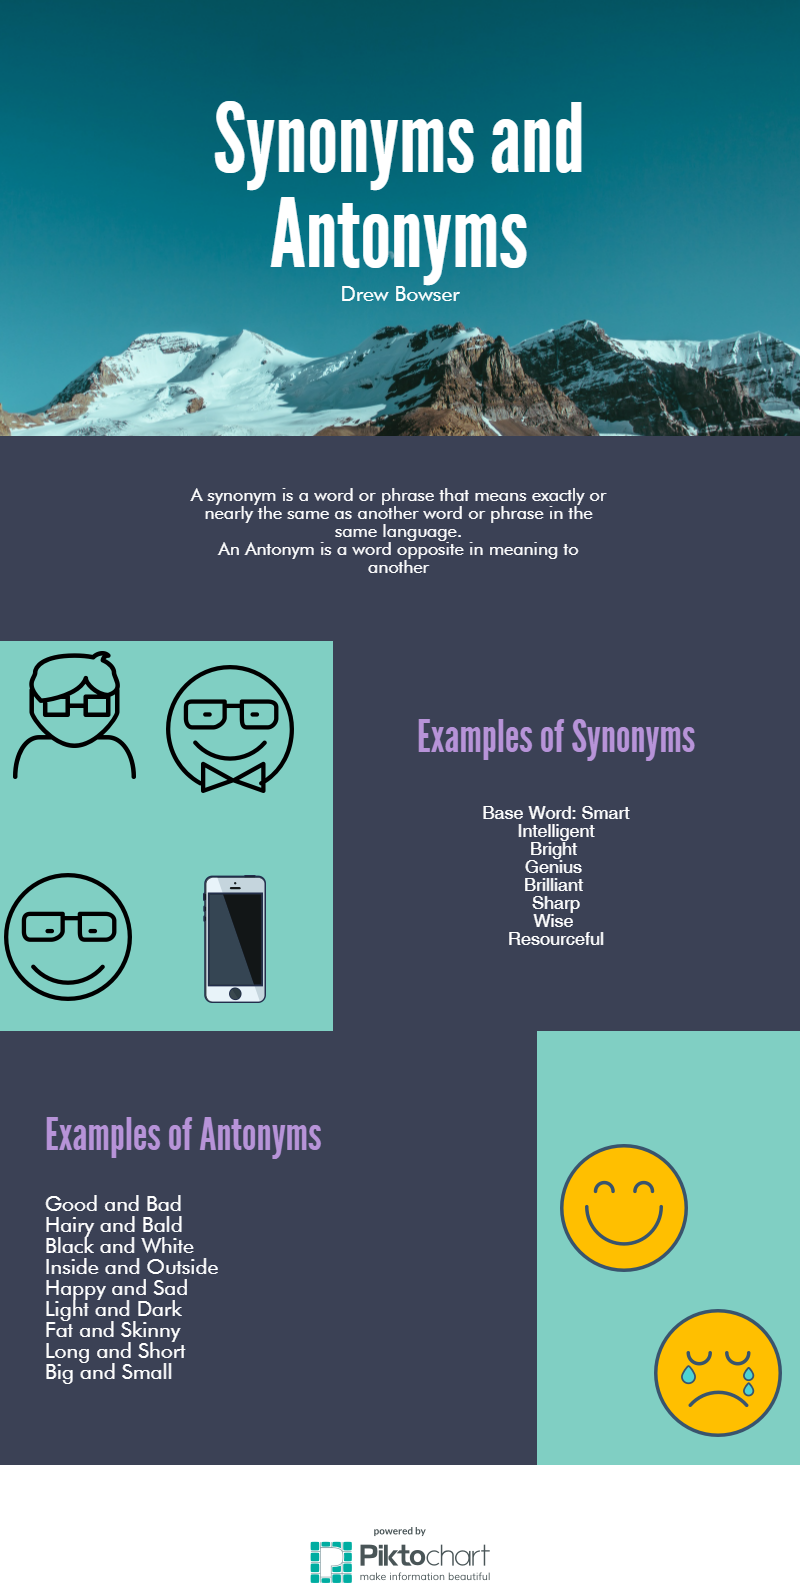
An infographic is a way of presenting information in a new way. It is simple and very user friendly. To create my Piktochart account I just logged on using my google account. From there, I played around with the tools and created some cool features.
I will use this tool in my future classroom by having my students use it to create projects. It is very simple and easy to use. My students can use this for presentations as well. I really enjoyed playing around with the tool. I realized how much cool stuff you can add do it and how you can really make it your own. This relates to the SAMR model because whomever is using this tool is creating something new. I can have my students use this and create something new such as a poster. Creating something shows mastery in that subject. |
